Is ChainLink ready to Breakout?
John Barry | Mon Jun 08 2020
The ChainLink price pattern is looking very strong. Since Bitcoin had its quick 1-hour price surge on Sunday, (which shows as the big red candlestick in the chart below) the $LINK chart looks great. The Trend Mean score is currently 76%, recently going bullish. It is now trading above its baseline. The volume as also increased for the past 3 candlesticks
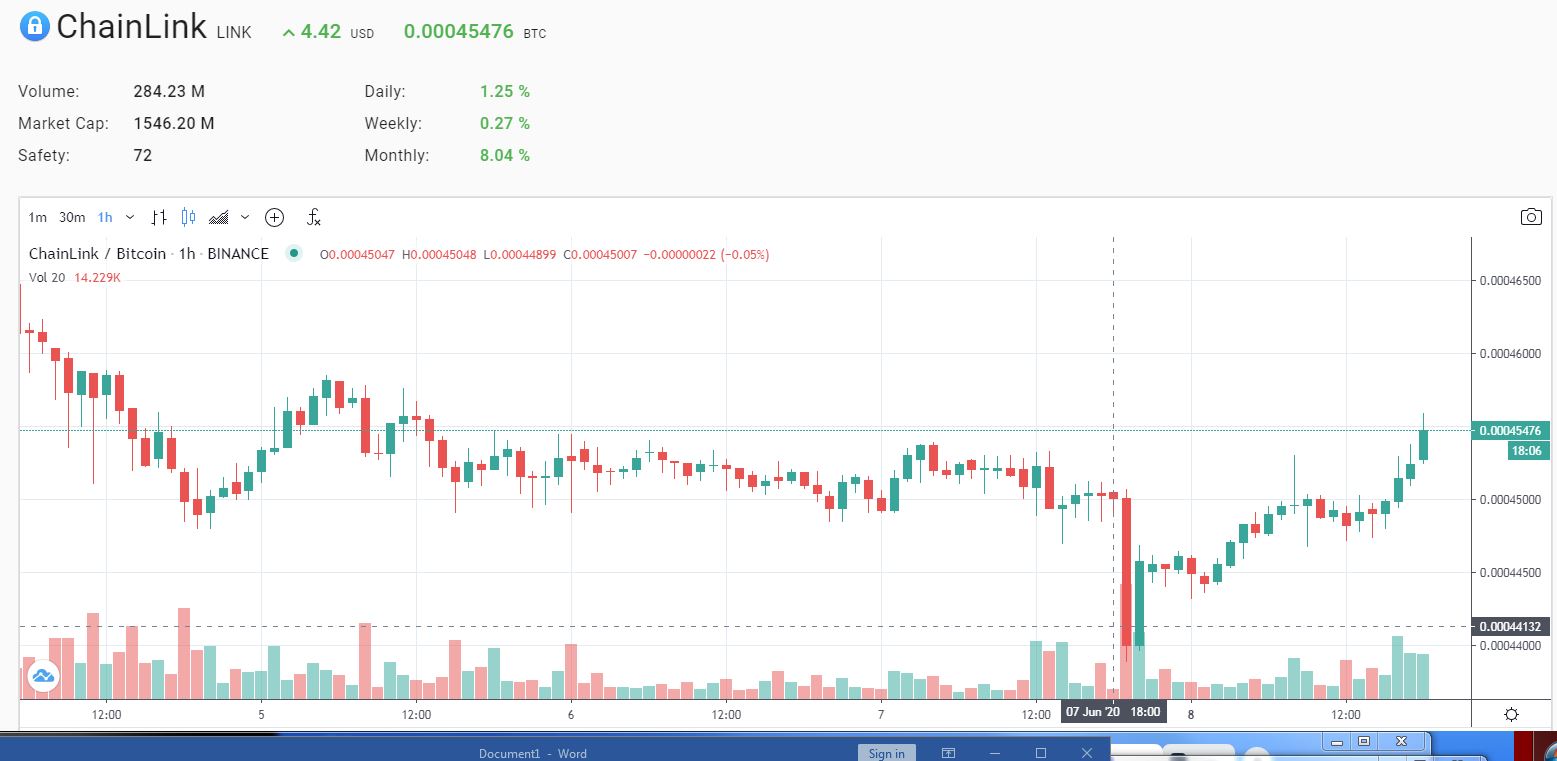
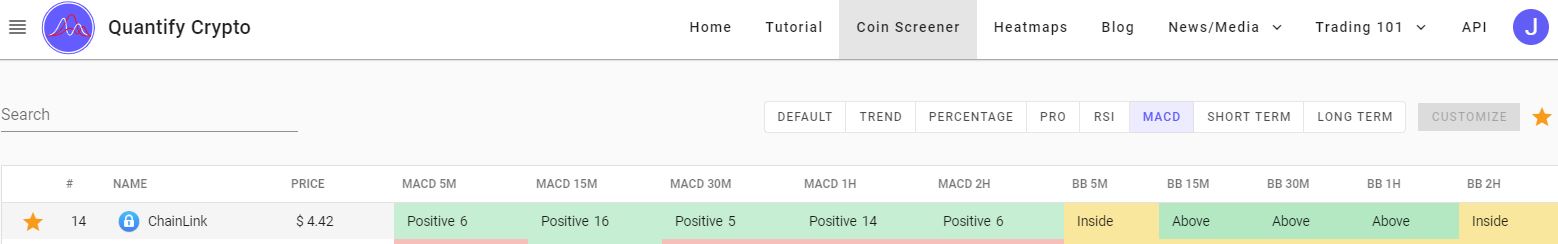
I always like seeing a slow steady increase for the 12 - 48 hour time period, which $LINK currently has. Additionally, multiple MACD indicators are bullish. MACD is one of my favorite confirmation metrics. Also, $LINK price is above 3 Bollinger Bands, showing the potential for a breakout
The platform Quantify Crypto provides live cryptocurrency prices, technical analysis, news, heatmaps and more. Our flagship product is the trend algorithm, designed to be on the correct side of significant cryptocurrency price moves. We are a new site, please check us out and let us know what you like and do not like about the site.
None of this is meant to be financial advice and I do not have any financial expertise. Although I worked at the New York Stock Exchange for over 23 years, it was as a developer supporting computer systems, not as a stock trader.
Full discloser: I do own Bitcoin and have stock positions.