Getting past FOMO, Sound Bites and Hype to Higher Bitcoin Prices
John Barry | Wed May 27 2020
I feel we have passed the FOMO periods of the Bitcoin halving that I wrote about on May 7th and the bogus Bitcoin Golden Cross sound bite narrative from May19th. I wrote about the bad-looking Bitcoin chart on May 21st. Many short-term traders (weak hands) entered the Bitcoin market in late April and May, based on the sound bites they were hearing. All these articles are in the QuantifyCrypto Blog:
https://quantifycrypto.net/blog
I do feel we are now past the hype period and ready for the math (not a sound bite for the crypto savvy enthusiast) of the Bitcoin halving to start kicking in. Fundamentally this is the de-inflationary mechanism being applied to Bitcoin while inflationary measures are being applied worldwide to the Fiat currencies.
Looking at the Bitcoin price action in May, the highs occurred on May 8th peaking at $10,030. Then a downturn to the lows of $8,260 occurring four different times from May 9th they May 11. A rebound to the $9,900 level on May 14, with multiple failed attempts to achieve higher levels for the next week. This led to the start of a negative trend on May 18 that brought the price back down to the $8,800 level on May 21st. A second rebound to the $9,300 level leading to a negative turn back to $8,700 level occurring 3 days in a row from May 24th to the 26th. Which leads us to now…
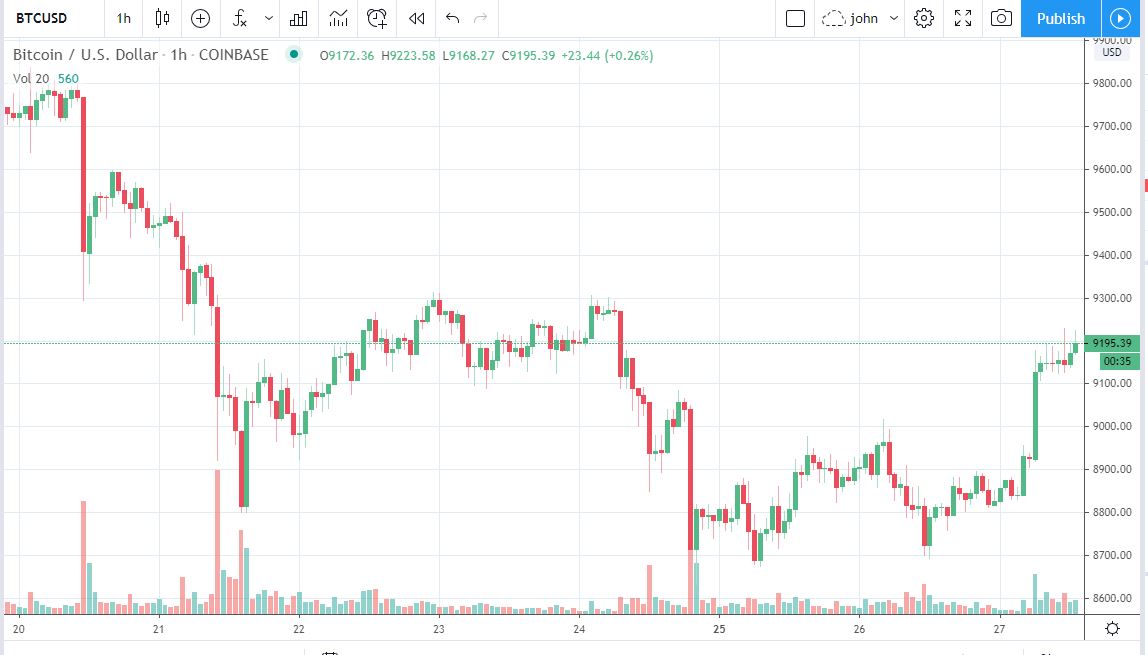
The current move since May 26th has bought the Bitcoin price back to the $9,170 level (at the time of this writing). We have had an upwards movement for the past day. The significant support level based on the May price movement is clearly at the $8,600 level. Price action below $8,600 has lasted for only short durations or downturns have failed to reach this level. Any price below $8,600 would be a clear bearish signal, I do not feel this level will be seen in the short term.
As for resistance, the $9,900 level is significant. Again, multiple attempts to go above this level have failed. A closer level to watch is the $9,300 price, which has failed during recent rebounds.
This current push looks like it can gain some momentum. As mentioned above: the weak hands are out, the math is on the Bitcoin bull side and the trend is currently positive. At the time of this writing, the Trend Mean score is 73% (bullish) after recovering from a bearish and neutral trend the past week. Bitcoin is trading above its baseline, and the 4 of the 5 MACD time periods are positive (the 15 minute MACD is on the verge of a bullish cross over). I view the 1 hour MACD candlesticks as the most important MACD time period.
Use this link to get the current technical indicators
https://quantifycrypto.net/coin-screener
The platform Quantify Crypto provides live cryptocurrency prices, technical analysis, news, heatmaps and more. Our flagship product is the trend algorithm, designed to be on the correct side of significant cryptocurrency price moves. We are a new site, please check us out and let us know what you like and do not like about the site.
None of this is meant to be financial advice and I do not have any financial expertise. Although I worked at the New York Stock Exchange for over 23 years, it was as a developer supporting computer systems, not as a stock trader.
Full discloser: I do own Bitcoin and have stock positions.